Kaggle Tricks
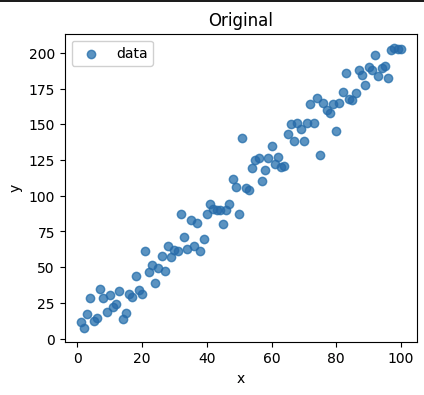
All is in the right scaling
import numpy as np
import matplotlib.pyplot as plt

# Make reproducible
np.random.seed(42)

# Generate data
x = np.linspace(1, 100, 100)
y = 2 * x + 5 + np.random.normal(0, 10, size=x.shape)

# Add outlier
y[50] += 30   # Outlier at index 50

plt.figure(figsize=(10, 4))
plt.subplot(1,2,1)
plt.scatter(x, y, alpha=0.7, label='data')
plt.title('Original')
plt.xlabel('x')
plt.ylabel('y')
plt.legend()
Can you catch the outlier?
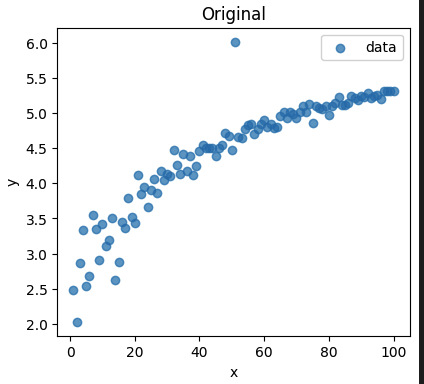
Same as above but with np.log(y)
Videos
There is alwasy a data property, barrier - breakthrough in the competition which makes the difference in the leaderboard. Find a feature which could change your modelling approach.
To do very very good you need to make a breakthrough. To have a breakthrough the secret is in the EDA. Make lots of plots, check correlation between things and eventually you get an intuition. It is all about the data.
Key components in Kaggle competitions:
- have a fast pipeline where you can run experiments (need to set a good local validation)
- RIGID EDA, to get intuition of the data
See something in the plots and you add a feature, split your model, modify the feature.
Is more features better? should I just get more and more features?
More features is generally better. As long as your features bring novel information it is good.
Decision trees have built in Feature Selection. for each split you choose the best split - it is a feature selection algorithm.
So do we really need FS when training Decision Trees (LGBM, XGBOOST). The answer is yes. You still need. It does happen your model on the sample data might pick up noisy feature. So you still need FS.
Feature selection can reduce the number of features and you can get your AUC/Score up by a few points.
scikit-learn
- Univariate analysis:
- variance threshold
- F-test (ANOVA)
- Forward selection in simple Ridge regression
- RFE (recursive feature elimination) a Kaggler says it works well
There is some bias in the feature selection. If you do FS for Xgboost, then the features you et woud be good for the xgboost but might not be for Neaural Nets
Beyond scikit-learn
- Boruta
- Wrapper
- Loss based
- Subset
- ReliefF
- Filter method
- Distance based
- Ranking
Characteristics of Feature Selection Algorithms
- Feature space
- Univariate F-Score
- Multivariate (RFE, L1-based, Tree-based)
- Direction
- Forward
- Backward
- Ranking: F-score, L1-based
Most of the time in Kaggle competitons I spent 90% of the time on FS, FE, prepping the data.
Feature engineering is usually better that Feature Selection
Target Engineering - transform the target and make predictions on it to match the competition metric.
SMAPE for example is assymetric metric. If you transfor the target with log, you get a metric which is almost like MAE.
Understand the problem that is being solved. Understand the metric. Understand the data.
How good a feature is depends on the competition metric!!! Feature importance, correlations, etc. are not that important.
Setup good Cross validation local setup. You CV score should correlate with the public LB.
Track the Train-Test error GAP Large gap indicates overfit. When your CV score is increasing and the gap is not incrasing a lot, then you are not overfitting.
For xgboost/LGBM no need to worry about one hot encoding, or nan values. They handle it well.
Categorical features:
- large cardinality creates sparse data
- one hot encoding
- hash encoding (deals with new varaibles, may introduce collisions), avoids extremely sparse data
- label encoding (for every categorical variable give a unique numerical ID)
- count encoding (sensitive to outliers, may add log transform, replace unseen varaibles with 1)
- LabelCount encoding (rank categorical varaibles by count in the train set, no collisions)
- target encoding - encode cat varaibles by their ratio of target (becareful to avoid overfit, nested CV)
- use NN to create dense embeddings from categorical variables
- give NaN valies an explicit encoding instead of ignoring (use them only when train and test NANs are coused by the same, or your local CV proves it holds signal)
- expansion encoding (create multiple categorical varaibles from a single variable)
Numerical features:
- round numerical variables (form of lossy compression, retain most significant features of the data)
- sometimes too much precision is just noise
- binning (by quantiles, plot data to log for good interval binning)
- scaling (standard Z, MinMax, Root, Log scaling)
- impute missing (mean, median (robust to outliers), KNN,) add boolean column
- interactions (substraction, addition, multiplication, divison) Ignore human intuition!, weird interactions can give significant improvement
- create statistic on a row of data (number of NaNs, Number of 0s, Number of negative values, Mean, Max, Min, Skewness, etc)
- temporal variables (dates, needs backtesting)
- turn single features, like day_of_week into two coordinates on a circle
- for TS, instead of total spend, encoed things like spend in last week, month, etc
- hardcode categorical features like: date_3_days_before_holidays: 1
- spacial variables (find closeness between big hubs)
Neural Networks & DL
- NN claim end-to-end automatic feature engineering
- FE dying field? No - moves the focus to architecture engineering
- encode order of samples in dataset
Applied Machine Learning is basically feature engineering, Andrew Ng
A LOT OF TIPS AND TRICKS in this video.
If something does not work, does not stick to it.
to get a gold model you need to try crazy ideas. Most would not work, but if you get one good one you can get the gold.
Trick for feature engineering:
- add 1 noisy features
- compute feature importance for all features
- features which have higher rank than the noisy feature should generally be good features
- if your noisy feature is too high in rank, your model is overfitting on noisy features and gives them high rank
- you need to go through the top ranked features and see which of them your model is overfitting
Feature importance
Detect overfitting features
- remove the feature and if CV is not hurt your are good
- if removing the feature hurts CV, then use transformation on the feature
Feature engineering is a bit of an art. Feature X and Feature Y might be good only if you use both (as they have interation).
If your model has many features (e.g xgboost) try using small colsample. Usually you would use 80-90%. But when having MANY features, this way your trees would be almost independent and not correlated.
Working with NN or linear models, when a feature you have NAN, add additional boolean column.
NN are making feature engineering implicitly.
Giba talk, tips for feature engineering and selection
Kaggle Grandmaster and startup
- CPU/RAM management is 1st priority
- Work on a single model as long as you can (1 week for other models)
- ML is just function approximation of the real world
- Tree methods ARE sensitive to noisy/useless features (spend enough time in Feature selection...)
- In kaggle you do not always have CV LB correlation (you have absolute noise in the LB, or the dataset is very small)
- Every time the dataset is small - you can do 5 Fold CV, repeated with 20 different CV splits. Models bagged 20 times - 2000 models in total to train just 1 model.
When averaging models in forecasting tasks help
LB CV Scores
- Compute correlation between LB and CV scores!
- Local CV setup to be as close as possible to the Kaggle API.
Model augmentation
- Bagging
- same model trained on different folds
- same model trained on different seeds (if data is very noisy)
- same model trained on different features
- same model trained on different hyperparameters
- different models take weighted average/mean (careful for MAE usually it hurts)
- Stacking
- Boosting: train on the errors
- Use output of one model to be features of another model
- Detrending
Powerful features
-
unbiased feature
featureX - groupby(FeatureY)[FeatureX].mean() -
previous FCT error feature (difference between FCT and TARGET), kind of boosting method
-
rolling aggregates - mean, median, min, max, quantiles, std, kurtosis, skew
-
intercept and slope instead of mean aggregate, that is run linear regression on past samples within a window and put the intercept and slope as features
-
random feature trick
-
neighbors_target_mean_500: The mean TARGET value of the 500 closest neighbors of each row
Adversarial Validation
Adversarial Validation is a very clever and very simple way to let us know if our test data and our training data are similar; we combine our train and test data, labeling them with say a 0 for the training data and a 1 for the test data, mix them up, then see if we are able to correctly re-identify them using a binary classifier.
If we cannot correctly classify them, i.e. we obtain an area under the receiver operating characteristic curve (ROC) of 0.5 then they are indistinguishable and we are good to go.
However, if we can classify them (ROC > 0.5) then we have a problem, either with the whole dataset or more likely with some features in particular, which are probably from different distributions in the test and train datasets. If we have a problem, we can look at the feature that was most out of place. The problem may be that there were values that were only seen in, say, training data, but not in the test data. If the contribution to the ROC is very high from one feature, it may well be a good idea to remove that feature from the model.
Check for covariate shift in train and test
- adversarial validation
- KS test for the features to see if they are from the same distribution
Check for target shift in train and test
Good to understand th dynamics of the target variable. If the target variable is changing over time, then you need to be careful with the train/test split. You need to make sure the train and test are from the same time period.
- KS Test
- T-test for mean shift
Hypothesis Testing / Normality tests
I think KS and normality tests are very sensistive for large datasets. If you have 10k+ observations, then you would get a very low p-value for any test. So you need to be careful with the p-value.
Any small shifts would be detected and would reject the null hypothesis.
So these tests are useful for small sample sizes. For large sample sizes you'd use the CLT and the t-test.
Kolmogorov-Smirnov test
- The two sample Kolmogorov-Smirnov test is a nonparametric test that compares the cumulative distributions of two data sets(1,2).
- The test is nonparametric. It does not assume that data are sampled from Gaussian distributions (or any other defined distributions).
One sample Kolmogorov-Smirnov test
It takes the difference between the empirical distribution of the sample and the theoretical distribution. Looks at the supremum which should converge to 0 almost surely.
Two sample Kolmogorov-Smirnov test
It takes the difference between the empirical distributions of two samples. Looks at the supremum which should converge to 0 almost surely.
Kolmogorov distribution shows the rate of this convergence.
In practice, the statistic requires a relatively large number of data points to properly reject the null hypothesis.
1k + points should be ok with error less than 1% (see wiki page).
- caveat is that this test is very sensistive, if the median, varaince,shape changes it would have low p-value
Interpreting the P value
The P value is the answer to this question:
If the two samples were randomly sampled from identical populations, what is the probability that the two cumulative frequency distributions would be as far apart as observed? More precisely, what is the chance that the value of the Komogorov-Smirnov D statistic would be as large or larger than observed?
If the P value is small, conclude that the two groups were sampled from populations with different distributions. The populations may differ in median, variability or the shape of the distribution.
T-test
- parametric method, used when the samples satisfy the conditions of normality, equal variance and independence.
This test assumes that the populations have identical variances by default.
Shapiro–Wilk test
Normality test
from scipy.stats import shapiro
The null-hypothesis of this test is that the population is normally distributed. Thus, if the p value is less than the chosen alpha level, then the null hypothesis is rejected and there is evidence that the data tested are not normally distributed.
- Better than KS one sample test as there you need to know the parameters of the distribution i.e. mean and variance. Cannot standaradize the data, as you would be going into a circle. you can't standardize by using estimated parameters and test for standard normal; that's actually the same thing.
- good with small sample sizes ~ 50 observations
- has more power compared to other normality tests, meaning it can detect deviations from normality more effectively.
- Not Sensitive to Outliers
Likelihood-ratio test
Change point detection in Time Series
Change point detection marks the locations where the underlying properties (statistical characteristics e.g. mean and variance) of the time series shift abruptly.
- target engineering and prediction switching
- target splitting, find its components
LGBM, XGBM , CATBOOST
- important hyperparams are usually: learning_rate, num_iterations, colsample, sample, max_depth, n_leaves, early_stopping, device type
- feature importance: use num_splits to select features, used as a guide for useful and overfitting features
- plot correlation between features
- get_split_value_histogram for each feature (lgbm): do that for the most important features
- get_leaf_output
- feature binning of continuous features (max_bin)
Feature Selection
Obviously you should only do this if it helps your CV.
All tricks by Chris Deotte:
- forward feature selection (using single or groups of features)
- recursive feature elimination (using single or groups of features)
- permutation importance
- adversarial validation
- correlation analysis
- time consistency
- train/test distribution analysis
- random feature trick
- remove low variance features
One interesting trick called "time consistency" is to train a single model using a single feature (or small group of features) on the first month of train dataset and predict isFraud for the last month of train dataset. This evaluates whether a feature by itself is consistent over time. 95% were but we found 5% of columns hurt our models. They had training AUC around 0.60 and validation AUC 0.40. In other words some features found patterns in the present that did not exist in the future. Of course the possible of interactions complicates things but we double checked every test with other tests.
Whatever feature selection you do you should separete feature selection from model training. This avoid data leakage. First do model selection and then model training.
Wrapper methods: these are model dependent
- forward selection
- backward selection
- recursive feature elimination (greedy optimization)
Filter methods: these are model independent, and involve preprocessing
- Pearson correlation
- LDA - linear discriminant analysis
- ANOVA
- Chi-Square
These methods does not remove multicollinearity.
Embedded methods: regularization
- Ridge, Lasso
Recursive Feature Elimination
- Rank the features according to their importance
- Remove one/or more features - the least important - and build a machine learning algorithm utilizing the remaining features.
- Calculate a performance metric of your choice
- If the metric decreases by more of an arbitrarily set threshold, then that feature is important and should be kept. Otherwise, we can remove that feature. Can run permutation importance on held out test set scikit-learn
Repeat steps 2-4 until all features have been removed (and therefore evaluated) and the drop in performance assessed.
MDI
Tree-based models provide an alternative measure of feature importances based on the mean decrease in impurity (MDI). Impurity is quantified by the splitting criterion of the decision trees (Gini, Log Loss or Mean Squared Error). However, this method can give high importance to features that may not be predictive on unseen data when the model is overfitting Permutation-based feature importance, on the other hand, avoids this issue, since it can be computed on unseen data.
Furthermore, impurity-based feature importance for trees are strongly biased and favor high cardinality features (typically numerical features) over low cardinality features such as binary features or categorical variables with a small number of possible categories.
This problem stems from two limitations of impurity-based feature importances:
- impurity-based importances are biased towards high cardinality features;
- impurity-based importances are computed on training set statistics and therefore do not reflect the ability of feature to be useful to make predictions that generalize to the test set (when the model has enough capacity).
Permutation importance
from sklearn.inspection import permutation_importance
Permutation importance does not reflect to the intrinsic predictive value of a feature by itself but how important this feature is for a particular model.
We measure the importance of a feature by calculating the increase in the model’s prediction error after permuting the feature. A feature is “important” if shuffling its values increases the model error, because in this case the model relied on the feature for the prediction. A feature is “unimportant” if shuffling its values leaves the model error unchanged, because in this case the model ignored the feature for the prediction.
To highlight which features contribute the most to the generalization power of the inspected model permutation importance should be computed on validation set.
Sklearn permutation_importance takes as input a fitted model. Thus based on the selected features/weights during training it computes the importance of the features. These features importance show how good are these features for this particular model.
Another take on feature importance is: to do permutation importance before model training. This should be done manually (I don't know about a library) Advatange is that is more acurate, disadvantage is that you loose a lot of time in training.
NB When two features are correlated and one of the features is permuted, the model will still have access to the feature through its correlated feature. This will result in a lower importance value for both features, where they might actually be important.
One way to handle this is to cluster features that are correlated and only keep one feature from each cluster.
Model Class Reliance
Dynamic label smoothing
Throw complex models on high weight data
2 submisssions = bet both on heads and tails
Random forecast
- produce ranomized forecasts multiple time. This is your baseline on what noise is in the competition.
Correlation Screening
- compute correlation of each feature with the target
Backlinks